Page 5 - Using Economic and Resource Maps
P. 5

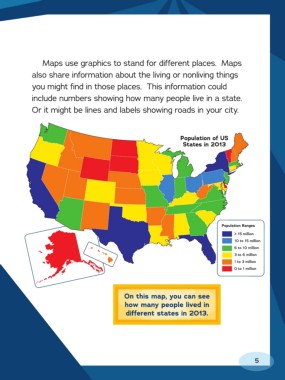
Maps use   graphics to stand for different places.  Maps

               also share information about the living or nonliving things
               you might find in those places.  This information could

               include numbers showing how many people live in a state.
               Or it might be lines and labels showing roads in your city.


                                                                  Population of US
                                                                   States in 2013


                                                                                Population Ranges
                                                                                     > 15 million
                                                                                     10 to 15 million
                                                                                     6 to 10 million
                                                                                     3 to 6 million
                                                                                     1 to 3 million
                                                                                     0 to 1 million


                                                   On this map, you can see
                                               how many people lived in
                                               different states in 2013.


                                                                                            5
   1   2   3   4   5   6   7   8   9   10